WORLD LEADING INSIGHTS

International LEADERS Calling Market Crashes Years Ahead
Second to None, Anywhere...

'Warned 2000 tech slide; predicted 2008 meltdown in 2007. Forecasted 2020 global economic collapse in 2011, AND NOW- BY 2050 - THE MOTHER OF ALL CRASHES"

Featured Post

#TROUBLE AHEAD AS #ICE SHELF DEVASTATED IN #ANTARCTIC

 REUTERS Thinning Antarctic ice shelf finally crumbles after heatwave By  Isla Binnie March 25 (Reuters) - An East Antarctica ice shelf disi...

Inspire, Achieve, Success

Search This Blog

SAVE ON HOT STUFF

Showing posts with label trends. Show all posts

Wednesday, May 20, 2015

#NASA Scientists Say Antarctica Ice Shelf On Verge Of Collapse

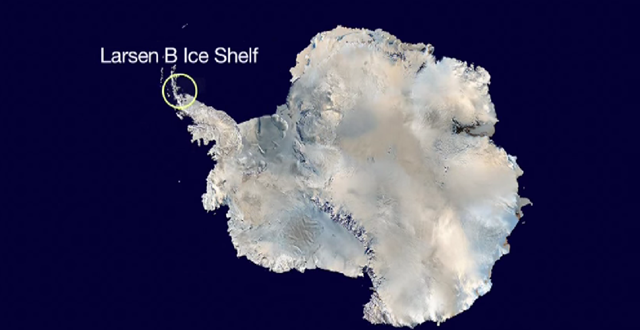
NASA Study Shows Antarctica’s Larsen B Ice Shelf Nearing Its Final Act


Antarctica's Larsen B Ice Shelf

A new NASA study finds the last remaining section of Antarctica's Larsen B Ice Shelf, which partially collapsed in 2002, is quickly weakening and likely to disintegrate completely before the end of the decade.
A team led by Ala Khazendar of NASA's Jet Propulsion Laboratory (JPL) in Pasadena, California, found the remnant of the Larsen B Ice Shelf is flowing faster, becoming increasingly fragmented and developing large cracks. Two of its tributary glaciers also are flowing faster and thinning rapidly.
"These are warning signs that the remnant is disintegrating," Khazendar said. "Although it’s fascinating scientifically to have a front-row seat to watch the ice shelf becoming unstable and breaking up, it’s bad news for our planet. This ice shelf has existed for at least 10,000 years, and soon it will be gone." Read More.

Here's A Picture From NASA Video -
Worth Watching


Dr. Kinesa's - Global Edge

Tuesday, March 25, 2014

Accurate 1972 Global Warming Targets


A remarkably accurate global warming prediction, made in 1972


By Dana Nuccitelli   

(Guardian) – John Stanley (J.S.) Sawyer was a British meteorologist born in 1916. He was elected a Fellow of the Royal Society in 1962, and was also a Fellow of the Meteorological Society and the organization's president from 1963 to 1965.

A paper [pdf] authored by Sawyer and published in the journal Nature in 1972 reveals how much climate scientists knew about the fundamental workings of the global climate over 40 years ago. For example, Sawyer predicted how much average global surface temperatures would warm by the year 2000.

"The increase of 25% CO2 expected by the end of the century therefore corresponds to an increase of 0.6°C in the world temperature – an amount somewhat greater than the climatic variation of recent centuries."

Remarkably, between the years 1850 and 2000, atmospheric carbon dioxide levels did increase by very close to 25 percent, and global average surface temperatures also increased by just about 0.6°C during that time.Sawyer also discussed several other important aspects of the Earth's climate in his paper. For example, he addressed the myth and misunderstanding that as a trace gas in the atmosphere, it may seem natural to assume that rising levels of carbon dioxide don't have much impact on the climate. Sawyer wrote,

"Nevertheless, there are certain minor constituents of the atmosphere which have a particularly significant effect in determining the world climate. They do this by their influence on the transmission of heat through the atmosphere by radiation. Carbon dioxide, water vapour and ozone all play such a role, and the quantities of these substances are not so much greater than the products of human endeavour that the possibilities of man-made influences may be dismissed out of hand."

(Read More)

Friday, October 18, 2013

Five Billion People Face Water Scarcity


Threshold level of ΔTg leading to significant local changes in water resources (a) and terrestrial ecosystems (b). (a) Coloured areas: river basins with new water scarcity or aggravation of existing scarcity (cases (1) and (2), see section 2.3.1); greyish areas: basins experiencing lower water availability but remaining above scarcity levels (case (3)); black areas: basins remaining water-scarce but without significant aggravation of scarcity even at ΔTg = 5 °C (case (4)). No population change is assumed here. Basins with an average runoff <10 mm yr−1 per grid cell are masked out. (b) Regions with severe (coloured) or moderate (greyish) ecosystem transformation; delineation refers to the 90 biogeographic regions. All values denote changes found in >50% of the simulations. Graphic: Gerten, et al., 2013

Water Scarcity

Five Billion At Risk

By the end of this century with concurrent trending in population growth it is projected that up to five billion people could be exposed towater scarcity. These figures are according to a recent scientific research letter published in IPOScience  (read more  above).  Here’s the real scary part – that assumes that temperature does not rise 1.5 to 2 degrees Celsius over pre-industrial levels. Guess what? We are trending to go higher because restrictive measures are not being implemented.  The number should be bigger!

The report referenced provides ample numerical, mathematical and modeling analysis if you have a geeky urge.  What cannot be emphasized enough is that we are not just talking about ducks and daisies here – we are talking about the essence of human life. Climate change is not a bad dream to be swept under the media carpet, and ignoring it may not affect our lives, but the misery we are leaving our children, grand children and so on, has never been imagined by any word constructions of any dictionary on the planet.

Now, I leave you with no further words - just that thought…  

Dr Peter G Kinesa
October 17,2013
Popular Museum Attraction - 2133 AD 


Friday, October 11, 2013

#America Shrinking Brains?


America Shrinking Brains?
Score Below Average On Global Tests
(Associated Press)

American adults score poorly on global test
Read More


This should come as no surprise to anyone that the intellectual levels in the United States have been drifting lower over the past couple of decades. In fact. this trend plays havoc with demographers and media types who are constantly dumbing-down their programs and content in order to adjust to the lower common denominator. Why the shrinkage in brainpower? Numerous reasons exist; ranging from I and X toys, immigration demographics, costly elitist education, drug use, celebrity culture and poor diets, just to name a few. And in the long-run this trend will have serious economic, political, social and military implications. It is a National Security risk and huge economic disadvantage that cannot be fixed in a few years.

Beyond the tests.scoring and reported reasons maybe the deeper cause lies in the shrinkage of American leadership - the pictures captioned below tell a tale of a nation lacking in the quality of character, skills, knowledge and capabilities that its people deserve and who would act as role models for its future generations.

Dr Peter G Kinesa
October 11, 2013

Or Shrinking Leadership?  


Tuesday, October 8, 2013

Food Shortages Now Rock #Venezuela

Food Shortages
Now Rock Venezuela
(PanAm Post Article)


Venezuela Reinforces Shortage Controls: Attorney General Threatens Punishment for "Hoarding"
Read More


Is It Exponential Math Yet?


Now what does Venezuela have in common with Syria, Egypt, Greece, Italy, Cyprus, Portugal  and a host of many others? Start with rapid population growth, and then add in a sharp decline in natural resources critical to generating export revenues needed to buy food stock for its growing number of mouths. The Flat J Curves that we observe globally are infesting individual countries who had for decades followed the false prophets (sic) of classical economic theory. Wealth was not created, rather it disappeared. 

Now look at what happens when those naive make-believe positive-sum games collide with real physical economic constraints that refuse to negotiate and do not allow more blood, or as in this case; OIL - to be drawn from the stone. Food Shortages result, turning to social unrest which then sets the stage for political upheaval. Anyone starting to see a pattern emerging here yet? Clearly, not the gurus working at the IMF, World Bank, UN and other bastions of astute and thoughtful analysis. 

We are not going to forecast the future here, but all minds should begin to turn to the insightful destiny of Nauru, Easter Island and others to see the path that most likely lies ahead for these failing economies. Economists may continue to mutter eloquently with gibberish that suggests these nations need to conform and adhere more rigorously to their naive growth theories and monetary doctrines. They all tried that nonsense. So why can't they create the wealth and grow out of it?

Because there is so much less to grow with, and too many more to grow for. It is a pie that is shrinking while facing demands of a rapidly growing population. And as we know, that sort of silly mathematics only works at the Highly Esteemed  Schools of Classical Economists. Voodoo math that is totally ignored by the physical laws governing - Entropy!

To close, we fondly observe - SNAFU 


Dr Peter G Kinesa
October 7, 2013 


Sharply Declining Resources


Rapidly Growing Populations


Equals = Exponential?


Wednesday, August 7, 2013

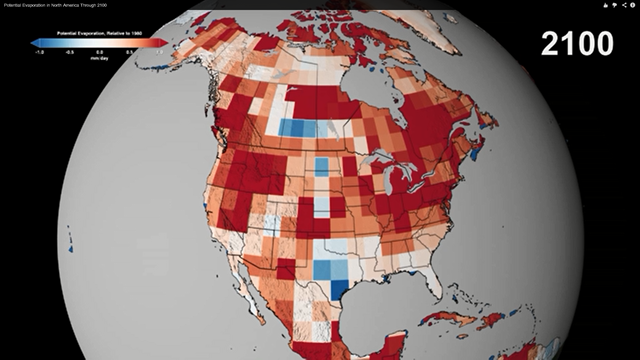
NASA "Our planet is evaporating" (Video)

(More)


"LET ME KNOW WHAT LIFE IS LIKE ON JUPITER AND MARS... IN OTHER WORDS"


For a moment, let's not debate what the cause is behind the increased trend in wildfires and lands now exposed to this threat. Rather lets acknowledge that this trend is not good because not only of the explicit life-threatening dangers posed, but also because it places arable farmlands and wildlife in greater jeopardy. This is not good economics by any means. (Remember, Bugonomics last month?)

Many years ago, CPA firms would claim their advisory leadership advantage and unique value proposition was through "getting behind the financial statements numbers". Perhaps economists and policy-makers should steal a page from the CPAs' slogans book and get behind the GDP numbers - because when they do, they should discover that real economic capacities are burning up or evaporating. These are the physical capacities that will drive the GDP numbers of tomorrow. Neat idea?

Maybe this same approach could have perhaps been helpful with urban management too - Detroit, New Orleans, Newark and so forth and thus slowing the evaporation of such centres. 

Hmm - "getting behind the numbers" - it has a catchy ring to it.  
  

Dr Peter G Kinesa
August 7, 2013


Satellite photos: Terra and Aqua

Projected increase in potential evaporation through the year 2100, relative to 1980, based on the combined results of multiple climate models. The maximum increase across North America is about 1 mm/day by 2100. This concept, potential evaporation, is a measure of drying potential or 'fire weather'. An average increase of 1 mm/day over the whole year is a big change, one we can put in specific terms: We consider a 1 mm/day increase in PE to be an 'Extreme' event for fires, something like 2012 in Colorado. By these projections, fire years like 2012 would be the new normal in regions like the western US by the end of the 21st century. Graphic: NASA

Motivate, Inspire, Positive