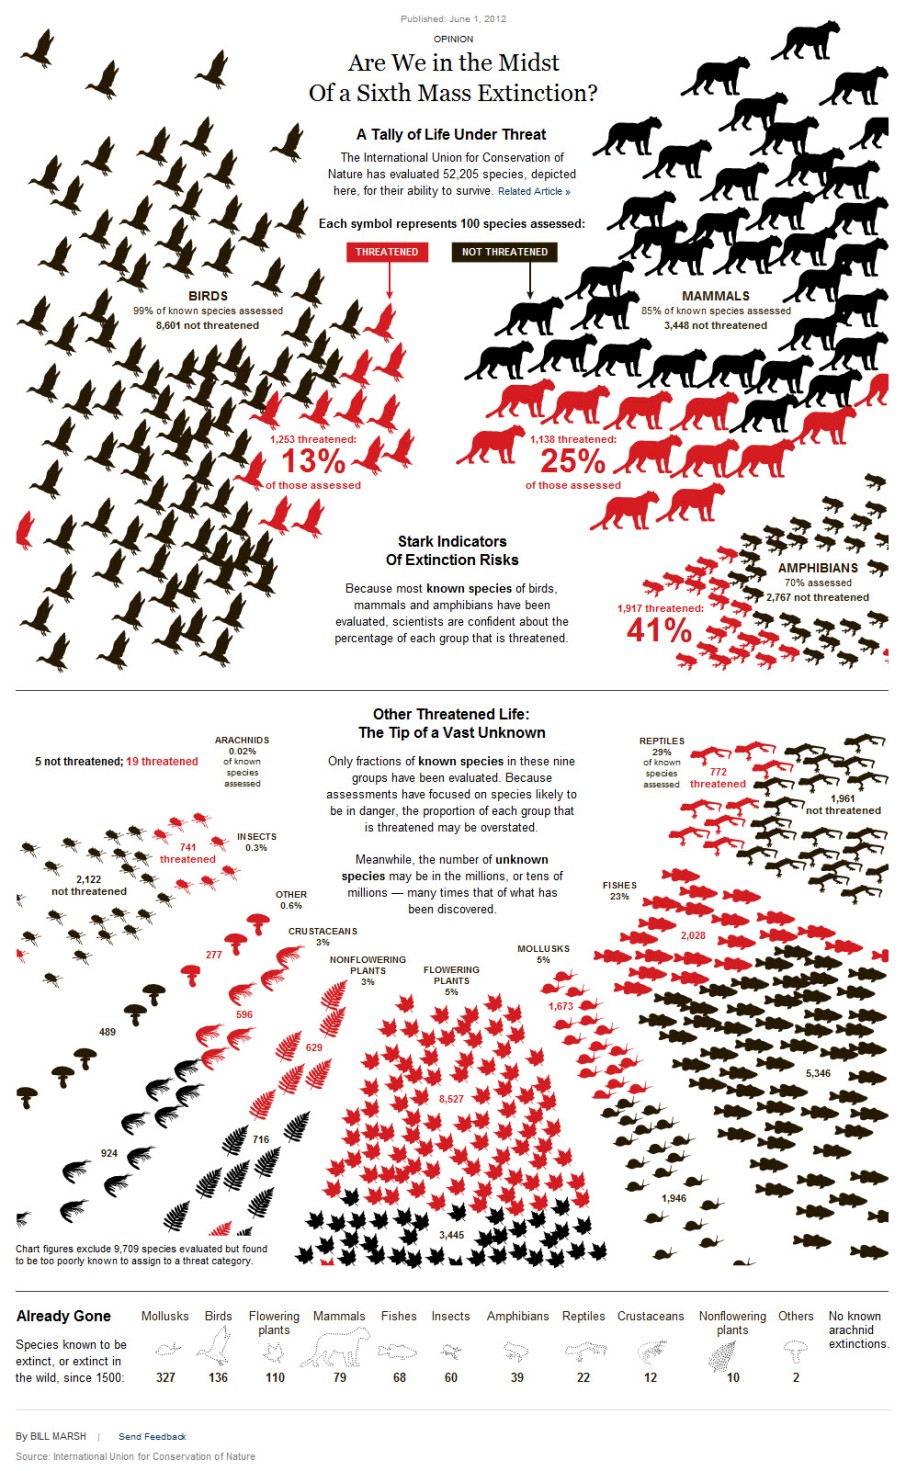
Infographic: Are We in the Midst of a Sixth Mass Extinction?
Are We in the Midst of a Sixth Mass Extinction? by Bill Marsh, Sunday Review Graphics Editor, New York Times
Bill Marsh’s black-and-red image depicts species at risk of extinction, based on data from the International Union for Conservation of Nature. When it comes to designing infographics, Marsh says there’s a dance between visual appeal and clarity of information. For example, he chose a big cat to represent all mammals because, “right away [they] convey that we’re talking about a certain type of animal, and big cats in particular are threatened.” To signify threatened flowering plants, he chose a maple leaf, because not all flowering species have the typical floral bloom. “We didn’t want to give people the wrong impression by literally selecting a flower image,” he says.
Infographic

Infographic

How humans are driving the sixth mass extinction
Scientists have been warning for decades that human actions are pushing life on our shared planet toward mass extinction. Such extinction events have occurred five times in the past, but a bold new paper finds that this time would be fundamentally different. Fortunately, there’s still time to stop it.
Impeachment of Dilma Rousseff
Privatization on a massive scale will take place in the coming years – perhaps comparable to Greece. Privatization will be accompanied by austerity programs, cutting of health and education benefits, of pensions and other social safety nets.
Coca-Cola Accused of Funding Colombian Death Squad
Coca-Cola along with more than 50 other companies were accused by Colombian courts of financing terrorism for their ties to the now-disbanded paramilitary organization.
China Plans To Boost Electric Vehicle Sales 10-Fold
While Tesla racks up a record-setting 400,000 presales for its affordable Model 3 due out next year, the world’s leading EV maker, China’s BYD, has already sold more EVs than Tesla, GM, and Nissan combined!
Community-scale solar can power corporations, too
Corporations are entering the renewables market in force, and they will find much to like in the community-scale solar market segment.

If Everything Is So Great, How Come I’m Not Doing So Great?
While the view might be great from the top of the wealth/income pyramid, it takes a special kind of self-serving myopia to ignore the reality that the bottom 95% are not doing so well.
We're ceaselessly told/sold that the U.S. economy is doing phenomenally well in our current slow-growth world -- generating record corporate profits, record highs in the S&P 500 stock index, and historically low unemployment (4.9% in July 2016).
While GDP growth is somewhat lackluster by historical standards—less than 2% in 2016—it's growth nonetheless. And the rate of consumer-price inflation is hovering around 1%; negligible by historical standards.
But this uniformly positive statistical view of the U.S. economy raises a question among those not in the top 0.1%: If everything’s going so great, how come I’m not?
Whether it's struggling to keep up with the rising cost of living, a 0% return on savings, working longer hours while real wages stagnate, scrimping to pay back education loans, despairing at the abuses of power in our banking and political systems, or lamenting the loss of nourishing social interaction in our increasingly isolated and digital lifestyle — most "regular" people find their own personal experiences to be at odds with the rosy "Everything is awesome!" narrative trumpeted by our media.
The Scorecard
To get a more concrete understanding of this gap, let's establish a scorecard we can individually fill in to make an assessment of just how well we’re doing.

